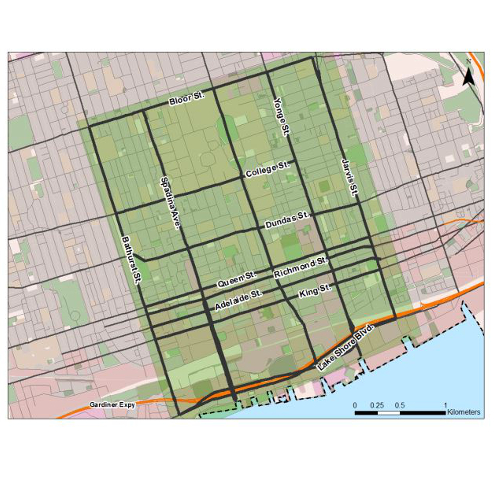
Toronto Road System Performance – Stretching the State of Knowledge

Project Description
While traffic congestion is a regular dinner-table conversation, media topic, and features centrally into discussions of transportation policy formation, newer data sources are only beginning to be integrated into policymaking circles as means to explore, track, and shape transportation system performance. This report represents one element of a larger study on using “Big Data” – in this case from Inrix, Inc. – to study road transportation system performance in the City of Toronto, focusing on the metric of travel speed. This study integrates data and model results from several sources to identify the slowest and fastest single days in 2014(January 1 through December 31)and portions of 2011(August 8 through December 31)and 2013 (July 1 through December 31). Only the freeways are analyzed for 2011 and 2013 while the freeway and arterial networks are each assessed independently for 2014 to focus the analysis on those system components which are best tracked by the available data for each year. Results suggest four major findings when focusing on mean daily travel speeds of “typical days.” First, weekend speeds are higher than weekday speeds. Freeway speeds are on average 7 to 10 kilometers per hour faster during weekdays than during the week. Second, most of the very slowest days of the year can be explicitly matched to snow and rain events. Third, those weekdays with atypically fast mean travel speeds are on holidays. Finally, daily travel conditions are much less stable during winter months than during summer months. This appears to be due to the joint impacts of the previous two factors: holidays (on which speeds are higher) and extreme weather events (during which speeds are lower). In sum, although severe incidents which trigger broader gridlock may severely impact the experiences of many downstream system users, the most pronounced patterns in daily freeway travel conditions stem from factors which are largely outside of the purview of policymaking: holidays, weekends, and weather.
The overall study was conducted in three parts: Congested Days: The first phase identified that the single most congested days occurred on days during which there was snow or rain. While this is in many ways expected, these results illustrate the role of weather in travel conditions and demonstrate the utility of these approaches when analyzing Big Data for performance monitoring.
City Congestion Trends: The second phase estimated changes in traffic congestion over the three year period from 2011 to 2014 by looking at annual, monthly, daily and hourly variations in performance metrics, including speed, delay, and unreliability. The study found that congestion did materially grow from 2011 to 2014, but the growth was uneven and congestion was in fact lower in 2013.
Corridor Report Cards: The final phase included a set of corridor report cards for 36 corridors across the City. Corridor report cards provided comparable snapshots of changes in performance between 2011 and 2014, hourly speed profiles for typical days of the week, and measures of unreliability. Results identified uneven changes in congestion over time among City roadways and expressways.
Reports:
Congested Days in Toronto
Congestion Trends in the City of Toronto (2011-2014)

